Hi, some times ago maybe even some years ago I was interested in micro controllers a lot. I wrote some basic articles (in polish) about how to start and create your first project.
After few years I decided to come back to that topic. I bought Arduino Uno, and create some simple projects with LED, engines, etc. But then I start to think how works SonOff devices. How they communicate via WiFi. That way I discovered ESP8266 module and … Oh, this is not article about micro controllers, so I cut a bit this story and tell you that I create my own Weather Station based on ESP8266 Nodemcu and DTH11 (in near feature I will write about this project in some article).
When I have few weather stations in my house (one in each room) I decided to aggregate data from them and store it in some database. When this part of my work was done, I started to think how to present all that results in simple and understanding way. So this was the beginning of @rign/weather-stations package, which is available in npm.
Assumptions
The list of main assumptions of that project is very short:
- display list of all Weather Stations in house
- display current temperature and humidity
- allow to view historical values in the simplest way
The first two points was very simple to pass, but the main goal was to present historical values in simple way. I thought about it very long time and finally I decided to use angular-highcharts library to present that data.
Development
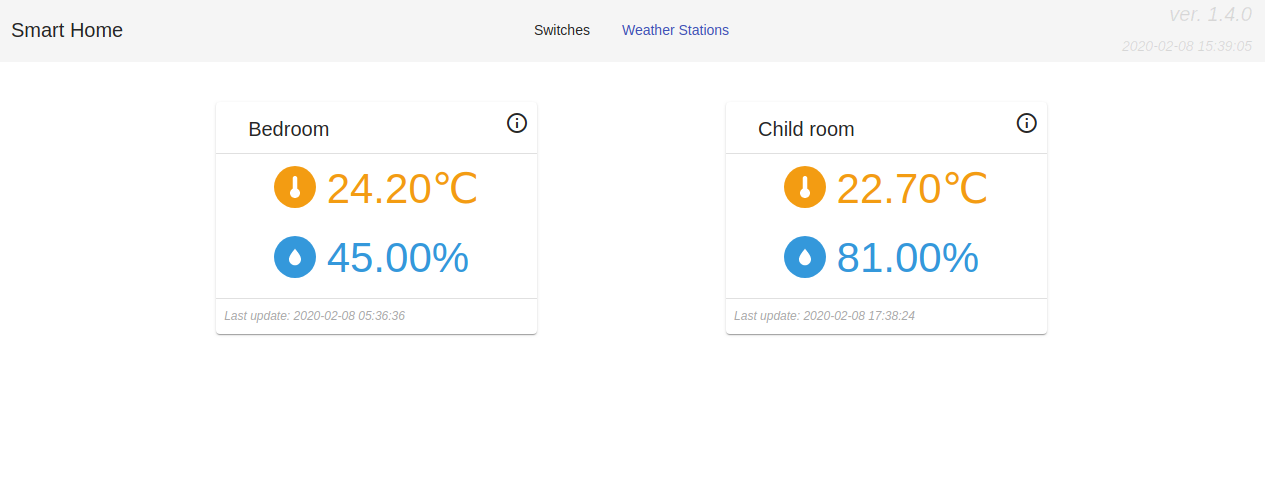
I started from displaying list of Weather Stations – it was simple task and the result you can see below.

Temperature in Celsius degrees is displayed in orange and humidity in blue. Each stations has its own name and information about last update (last read data from station). In right top corner of each Weather Station box you can find Info icon which redirects to details (historical data) screen.
This screen was more complicated. I started to display data from current day, but if I measure temperature four times on hour then on my chart was a lot of date and it was mess. In short period of time I found solution – let’s display average temperature and humidity in each hour. This approach allows me to display 24 values in one chart. It was simple, but I needed some time to understood it.
After that I realized that maybe I will need information from last 7 days (week), moth or even years. So I decided to use my „Day” approach and scale it to:
- last 7 days (average temperature and humidity for each last 7 days),
- month (average temperature and humidity for each day of the month),
- year (average temperature and humidity for each month of the year).
Solution was simple but I found that I missed one functionality. I can not move backward to yesterday and the day before yesterday and then move forward till today, also I could not move between months, I was able only to see results from current month. this was the signal that I had to create possibility to change the period of time backward and forward.
That functionality showed me another problem. If you move backward a lot and the you will try to come back to current day, you will need click a lot of time to „Next”. So I decided to add „Today” button which will appear only if the date is different than „Today”.
Installation
Installation is very easy, you have to:
- add npm depenedncy @rign/sh-weather-stations
- create weather stations wrapper module
- create API service which implements interface WeatherStationsApi
- add above service to providers as WEATHER_STATIONS_API
- attach wrapper module to you app routing
More details how to install and implement API you can find in project README on Github.
Conclusion
That’s all. You can find some screenshots of that module below. If you like it you can use it in your project. If you have some ideas do not hesitate to contact me and share.
